

Daily Ranking & Brief


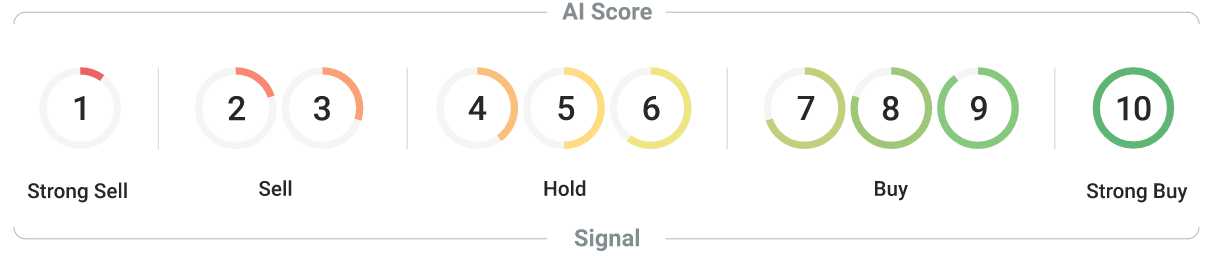
These are today's rankings based on our AI Score which rates ETFs every day from 1 to 10 according to the probability of beating the market in the next 3 months, analysing +900 fundamental, technical, and sentiment indicators.
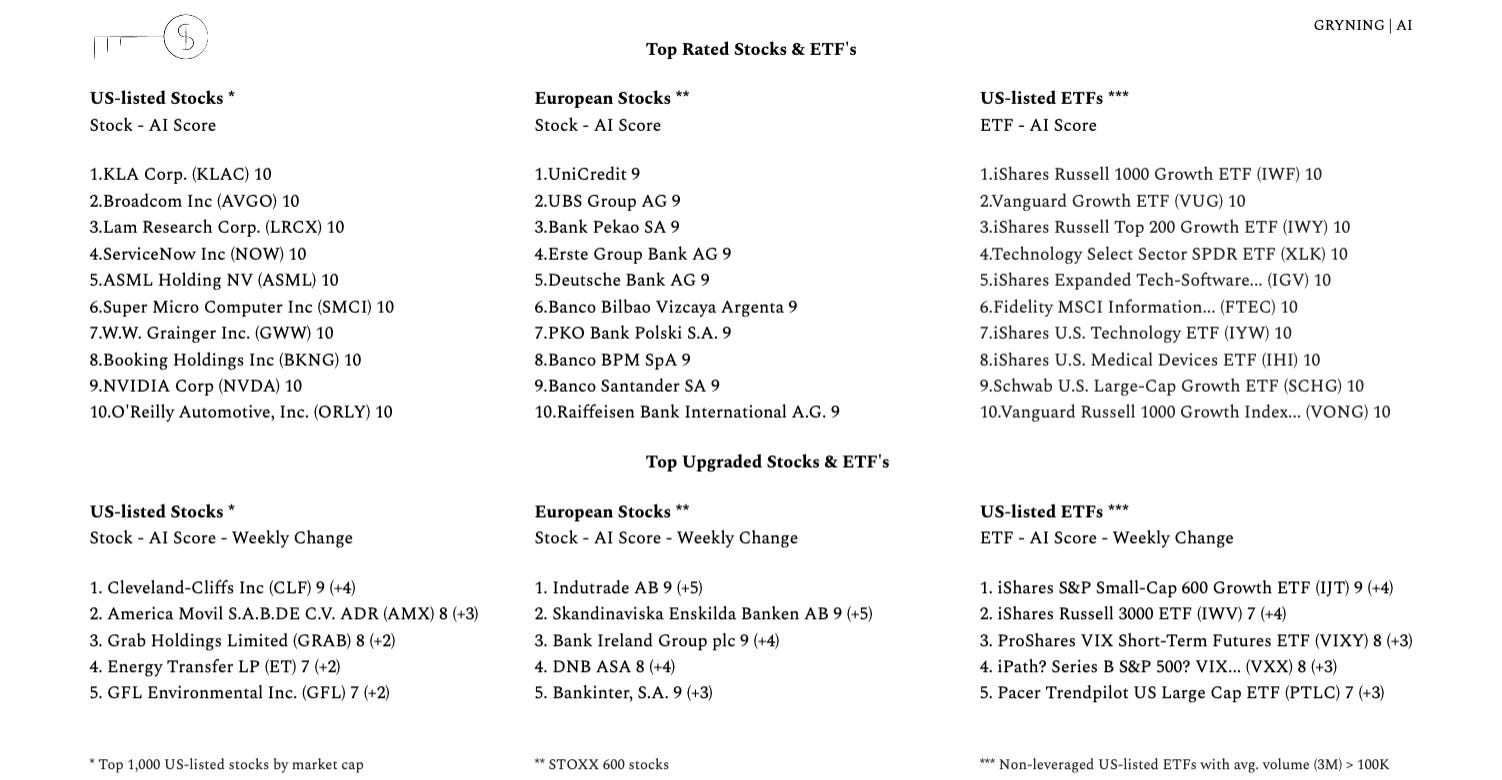
Access Stock, ETF & Sector Rankings and Factor Models for the US & European markets, alongside Alpha Signal Analysis and Top 25 Trade Idea’s (long & short).

Inflation Sticks Around - Friday's inflation data presented a complex scenario for the U.S. economy and the Federal Reserve's monetary policy, showing that the fight against inflation is still ongoing.

According to the March report, U.S. inflation rose to 2.7%, surpassing expectations of a 2.6% increase and highlighting sustained price pressures. This uptick, driven largely by increased petrol costs and notably "sticky" service sector costs like shelter, comes at a precarious time as the Federal Reserve grapples with decisions on interest rates.
The data, revealed that core PCE, which excludes volatile items like food and fuel, held steady at 2.8%. This stability in core inflation, contrary to anticipated decreases, suggests an underlying resilience in inflationary pressures, despite broader economic efforts to cool them.
Market reactions were notably mixed. Equity markets saw a rebound with the S&P 500 and Nasdaq Composite climbing, driven by significant gains in tech stocks like Alphabet. However, moves in the bond market were more subdued, with yields on two-year and ten-year government bonds showing minimal changes.
This inflation report complicates the Fed's plan to potentially lower interest rates this year, especially in light of the slow economic growth recorded in the first quarter. Futures traders have now adjusted their expectations, fully pricing in the possibility of a rate cut only by the Fed's November meeting, just after the U.S. presidential election.
Response from US sector: Here are the historically best and worst performing sectors on a 1-month horizon, when 10Y yields cross 4.7%:
Best performing assets:
S&P Oil & Gas Exploration & Production: 5.12%
S&P Materials: 2.98%
S&P Retail: 2.25%
Worst performing assets:
S&P Banks Select Industry Index: -0.81%
S&P Health Care: -0.28%
S&P Consumer Staples: -0.11%